With digital advancements like AI and online touchpoints everywhere we turn, data is piling up at an increasing rate every year. To stay competitive in 2026, your business needs to know how to gather, interpret, and make the most of this valuable information.
Data analytics transforms streams of numbers into impactful insights and scalable strategies. With the right tools, decision-makers can deep-dive into data sets to identify trends, bottlenecks, and revenue drivers across departments.
Here, we break down the benefits of data analytics for businesses, as well as its common challenges, helpful tools and top tips for getting started.
What is business analytics?
Business analytics is the process of collecting, organising and examining past and current business information to guide strategic decision-making. It turns raw data from areas like production, finance, sales, and HR into actionable insights.
With features like live dashboards and custom reports, data analytics systems flag areas for improvement with greater clarity and certainty. These platforms can pinpoint where costs are rising, where employees are losing time, which customers need attention and which parts of the operation are underperforming.
Ultimately, data analytics helps paint a full, accurate picture of what’s happening now, so you can plan for the future. Improve operational efficiency, reduce costs, spot risks earlier and act on opportunities with more confidence.
The different types of data in business analytics
The four main types of business analytics are descriptive, diagnostic, predictive and prescriptive analytics. Each one can work on its own, but they deliver stronger value when used together.
For instance, a business might use descriptive analytics to spot a trend, diagnostic analytics to understand the cause, predictive analytics to forecast the impact and prescriptive analytics to decide what to do next.
Let’s take a closer look at each type.
1. Predictive data analytics
Predictive data analytics uses past and current business data to forecast what’s likely to happen next.
Through statistical modelling, machine learning and historical data, it helps businesses identify patterns and relationships that can guide planning, budgeting, sales, operations and customer decisions.
For example, a business could use predictive analytics to estimate future product demand, forecast revenue, identify customers at risk of leaving or predict which marketing audience is most likely to convert.
The goal isn’t to guarantee the future, but to give leaders a clearer view of likely outcomes before they make a decision.
2. Prescriptive data analytics
Prescriptive data analytics helps businesses decide what action to take next. It uses data, modelling, testing and optimisation to compare different options and recommend the path most likely to deliver the best result.
A business might use prescriptive analytics to decide which product to promote, how to allocate staff, which customer segment to target or what pricing strategy to test.
This type of analytics often works alongside predictive analytics. Predictive analytics shows what might happen, while prescriptive analytics tells you what you should do about it.
3. Diagnostic data analytics
Diagnostic data analytics looks at past performance to understand why something happened. It helps businesses move beyond surface-level reporting and find the cause behind a change, problem or result.
Imagine your monthly sales have dropped. Diagnostic analytics could show whether the issue came from fewer leads, lower conversion rates, reduced stock availability, pricing changes or staff capacity.
Common diagnostic techniques include drill-down reports, data discovery, correlation analysis and data mining. These tools help you uncover the reasons behind the numbers, so you can fix problems for good and make more informed decisions.
4. Descriptive data analytics
Descriptive data analytics summarises what’s already happened in a business. It answers basic but essential questions like what changed, how much changed, where it happened and when it occurred.
Businesses use descriptive analytics in dashboards, sales summaries, financial reports and operational performance reviews. These tools give teams a clear view of activity and performance across different parts of the business.
Descriptive analytics also tends to include scheduled reports and ad hoc reports. Scheduled reports track known metrics regularly, while ad hoc reports answer specific questions as they come up.
Both help businesses to deep dive into past performance before they investigate causes, forecast future results or choose the next action.
How data analytics can help business performance
Unpacking raw data can help you stay agile, improve efficiency, and gain a competitive advantage in today’s crowded markets. Here’s why data analytics is important for every modern business.
Increased revenue
Data analytics helps businesses spot where revenue is growing, where margins are shrinking and where better decisions can unlock profit.
By analysing customer segments, seasonal demand, competitor activity, buying habits and product performance, you can see which opportunities are worth pursuing and which areas are draining time or budget.
These data insights support sharper commercial decisions. You might identify an underserved market, focus budget on higher-value clients, restructure pricing, retire unpopular products or cut avoidable operational costs.
Optimisations like these often lead to measurable financial gains. Research has found that businesses that can measure the value of their data analytics reported an average 8% increase in revenue and a 10% reduction in costs.
This value comes from better visibility. When your business can determine what drives sales, what customers want and where performance is slipping, you can make more strategic decisions that support growth.
More confident decision-making
Data analysis paves the way for more effective decision-making. Instead of relying on instinct, assumptions or one person’s view, you can use real, impartial evidence to weigh up your options.
Data from sales, operations, finance, customers and external sources can help you decide where to invest, which processes need attention, which campaigns are worth backing and which ideas need more testing before any money is spent.
That said, data only helps if it’s relevant and reliable. Before using data to guide an important business decision, you should check:
- Who collected it
- How it was collected
- When it was collected
- Where it came from
- Why it was collected
- How many records or responses it includes
- Whether it represents the wider customer group or market
This matters most when reviewing percentages. A figure can look convincing, but if it’s based on a small or narrow sample, it mightn’t reflect the complete picture.
Enhanced efficiency
Data analytics helps businesses work smarter across every part of the operation.
By reviewing workflow, supply chain, service, inventory and performance data, you can see where processes are slowing down, where costs are creeping up and where resources could be used more effectively.
An analysis can reveal issues like delivery delays, stock loss, repeated admin tasks, supplier issues, underused equipment or team bottlenecks. From there, businesses will be able to make practical changes that save time, reduce waste and improve output.
For instance, supply chain analytics can show where freight delays happen most often or which suppliers are creating avoidable costs. Operations teams can then adjust ordering, improve stock control, review vendor performance or fix process gaps before they affect customers.
The benefit is clear. When accurate data is easy to access, teams can make improvements faster, respond to business problems sooner and streamline day-to-day tasks.
Stronger risk management
From suspicious transactions and supply chain delays to compliance issues and stock discrepancies, business analytics helps you spot risks before they become serious problems.
By tracking patterns across finance, operations, and customer activity, you can flag unusual behaviour, weak points and early warning signs, then take proactive measures to prevent them.
Analytics also helps businesses measure the size and likely impact of each risk factor. That makes it easier to focus time, budget and resources on the issues that could affect revenue, service delivery, compliance or customer trust.
A better customer experience
Data analytics helps businesses understand what customers want, where they get stuck and what makes them come back.
By looking at purchase history, website activity, service interactions and customer feedback, you can build a clearer picture of the complete customer journey.
This makes it easier to improve the parts of the experience that matter most. Analytics can show where customers abandon a form, which support issues keep coming up, which products are often bought together or when people are most likely to respond to a reminder or offer.
Customer data also helps businesses personalise the experience. Instead of sending the same message to every customer, teams can tailor offers, product recommendations and service updates based on real behaviour.
Useful customer experience data can include:
- Transaction data, such as purchase history, repeat orders, discounts and promotions used
- Demographic data, such as location, customer type or age group
- Engagement data, such as website visits, email clicks, loyalty activity and social media interactions
- Product or service choices, which can reveal upsell, cross-sell and packaging opportunities
- Feedback data, such as reviews, surveys, support calls and customer comments
- Loyalty signals, such as retention, referrals, repeat purchases and subscription activity
The more a business understands its customers, the easier it is to remove friction, elevate service, and improve customer retention rates.
Targeted campaigns
Data analytics helps businesses reach the right people with the right message. By analysing customer behaviour, sales activity, online engagement and transaction data, you can see which audiences are most valuable, how they behave and what encourages them to act.
Ultimately, these insights make marketing more focused and cost-effective. Instead of relying on broad campaigns, you can tailor offers, messaging and channels around proven customer patterns.
This improved targeting can help you attract new customer segments, boost engagement, build loyalty and reduce wasted ad spend.
For example, a retailer could use point-of-sale data to identify which products sell best in certain locations, seasons or customer segments.
Equipped with this information, its marketing team can then create campaigns that speak directly to those audiences, with stronger timing, clearer messaging and better chances of conversion.
Opportunities for innovation
Data analytics helps businesses see what customers need next and deliver the solution. By tracking customer feedback, product performance, buying behaviour and market demand, you can uncover gaps before they turn into missed opportunities.
These insights can shape new products, stronger services, smarter pricing, sharper marketing and more useful customer support.
For example, data might show that customers keep asking for the same feature, dropping off at a certain point in the buying journey or choosing a competitor because of price, availability or service speed.
It also gives teams a better way to test new ideas.
Rather than relying on assumptions, you can use data to improve what already exists, trial new offers and respond faster when customer expectations change.
The most common challenges in data analysis
Data analytics can create real business value, but strong results depend on getting the foundations right. Here are the most common obstacles that stand in the way of business success:
Low-quality data
Data quality matters. If data is outdated, duplicated, incomplete, inconsistent or taken from the wrong source, analytics can point your business in the wrong direction.
Before using data for reporting or planning, businesses need to check where it came from, whether it answers the right question and what needs to be fixed first.
This can include removing duplicate records, correcting formats, filling missing fields and checking that each source is accurate and relevant enough to support business decisions.
Data silos
Many organisations store data across separate platforms, spreadsheets, departments and legacy systems.
Sales, finance, operations, HR and customer service might all hold valuable information, but when those systems don’t talk to each other, teams end up working from different versions of the truth.
This creates more manual reporting, more repeated data entry and more room for error.
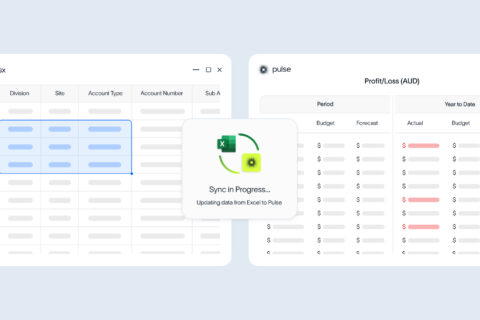
Integrated software like Pulse Analytics connects with any system to present data from every department on one clear platform. With a single source of truth, it’s easier to compare results, identify trends and act on the same information.
Rigid systems
A data setup that works today won’t necessarily support your business tomorrow. As more users, systems, reports and data sources are added, older processes can become slow, difficult to manage and harder to trust.
Scalability problems often show up as delayed dashboards, manual workarounds, overloaded spreadsheets or reports that take too long to produce.
Planning for growth early and choosing agile software will help ensure your analytics setup can easily handle more complexity as you grow.
Data security breaches
Data analysis often involves sensitive customer, employee, financial and operational information. Each time that data moves between systems, platforms or users, it needs the right protections in place.
Businesses need role-based access, secure integrations and strict data privacy protocols, so people only see the information they need for their work.
This helps reduce compliance risk, protect sensitive information and build trust in how data is managed.
A lack of data literacy
Data analysis demands more than software. Businesses need people who can ask the right questions, handle data properly, interpret results and translate insights into action.
That can be difficult when experienced data specialists are expensive or hard to hire.
Many organisations can close the gap by training current staff or using simple digital tools like Pulse, which makes data management easy for even the most non-technical team members.
Tips for getting the most out of data analytics tools
Data analytics software works best when it’s tied to real business goals, linked to trusted data sources and leveraged by trained team members.
Before rolling it out across your business, make sure to:
- Set goals before choosing a tool: Decide what you need the software to help you achieve first, whether it’s reducing downtime or improving customer satisfaction rates. A defined outcome helps you choose and customise data analytics software around the areas that will deliver the most value.
- Choose easy-to-use software: Data analytics software should make information easier to understand, not harder. Look for intuitive dashboards, visual reporting, simple filters and flexible tools that work for both technical and non-technical users.
- Connect your key systems: Analytics is more valuable when it pulls information from across the business. Connecting your ERP, CRM, finance, operations, marketing and asset systems can reduce manual reporting, streamline communication, and give teams a full view of performance.
- Keep your data accurate and consistent: No software can fix poor data on its own. Before relying on reports, check for duplicate records, missing fields, outdated information and inconsistent formatting.
- Train your team properly: Software is only one part of the puzzle. You need to train staff to read dashboards, draw conclusions and apply insights to their daily work. This helps analytics become part of normal decision-making, instead of something only one specialist team understands.
- Encourage employees to learn, question and innovate: Data analytics should help people investigate what’s happening and why. Encourage teams to test ideas, compare results and look for patterns that can improve performance, reduce waste or create better customer experiences.
Make data-driven decisions with Pulse Analytics
Business analytics doesn’t have to be complex or time-consuming. With the right technology, it’s easy to gain meaningful insights and a competitive edge.
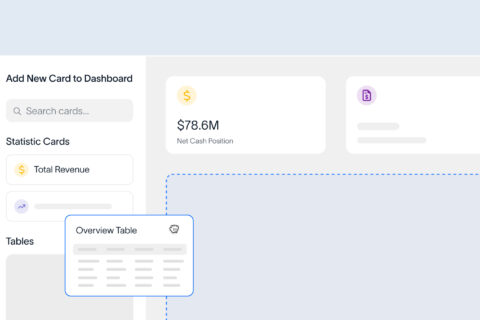
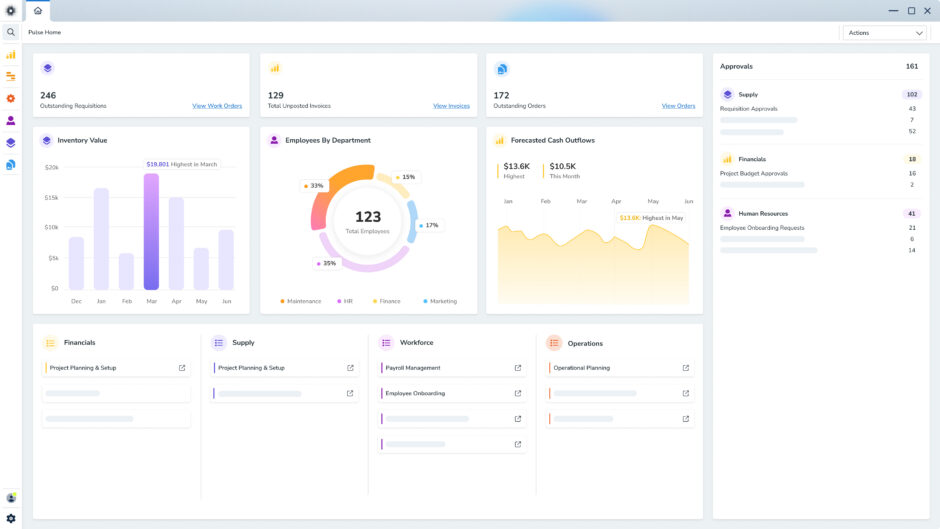
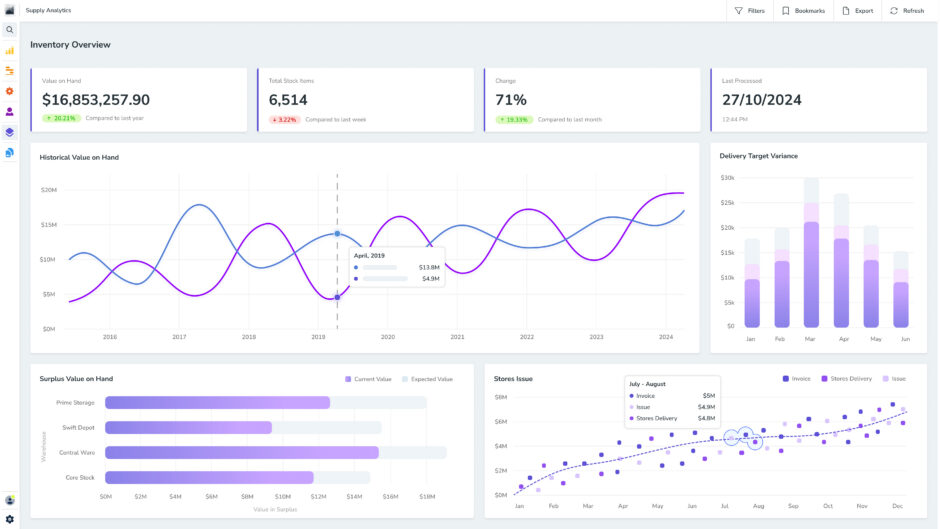
Pulse Analytics brings both structured and unstructured data from your ERP and third-party systems into intuitive Power BI dashboards with clear visualisations. The result is a comprehensive view of performance across departments, in one place.
Tailored to the way you work, this strategic tool helps you track KPIs, assess historical trends, run cross-module reports and streamline operations over time. No disconnected spreadsheets or manual data handling needed.
Discover how Pulse Analytics can help you harness data for stronger decision-making in any business context. Request a free demo today.