Every producer is chasing the same outcomes: more output, consistent quality, and controlled costs. To achieve those goals, you need to understand, measure and optimise for production efficiency.
This metric shows how well your facility is converting resources like labour, equipment, and materials into finished products. Essentially, it highlights whether you’re operating at your true capacity or losing output somewhere along the way.
In this guide, you’ll learn exactly what production efficiency looks like in practice and how to calculate it. We’ll also cover the key constraints that hold operations back and steps you can take to drive output, minimise waste, and keep costs in check.
What is production efficiency?
Production efficiency is how well your business turns inputs like labour, materials, equipment and time into finished products, with minimal waste and reliable quality.
At its best, production efficiency means you are producing as much as possible from the resources you already have. Your machines are running when they should be, your team is productive, and output meets demand at the lowest possible cost per unit.
Low production efficiency results in wasted time, excess material use, higher costs, and missed production targets. Common causes include process bottlenecks, equipment downtime, poor maintenance, supply chain delays, or outdated systems.
For manufacturers, improving production efficiency is one of the fastest ways to increase output, protect margins, and stay competitive without needing to invest heavily in new resources.
Importantly, you should never cut corners to do this. Instead, production efficiency involves making more with less while maintaining product quality. Any gain that comes from slipping standards isn’t true efficiency.
Production efficiency vs. productive efficiency
The terms production efficiency and productive efficiency are often used interchangeably, but there is a slight difference in how they should be applied.
Production efficiency is practical and operational. It looks at how well your plant actually runs.
Are your machines operating at capacity?
Is downtime under control?
Are labour and materials being used properly?
Basically, it’s about real performance on the floor.
On the other hand, productive efficiency is more theoretical. It describes the ideal state where a business produces goods at the lowest possible cost, with zero waste.
That said, both terms are focused on the same goal: producing more with the resources you already have, without sacrificing production consistency.
How to measure production efficiency
Production efficiency is calculated by comparing what you actually produce against what you should be producing.
It shows how close your operation is to its expected output, based on available resources, capacity, and standard performance levels.
Not sure where to start?
Let’s walk through the steps.
1. Determine actual output
Actual output is the number of finished, saleable units produced over a specific period.
This should only include products that meet your required standard. Scrap, defects, and rework should be excluded, as they don’t contribute to true output.
In most operations, this data is already captured through production systems, making it easy to track daily, per shift, or per batch.
2. Confirm standard output
Standard output is the level of production you expect to achieve under normal operating conditions.
This is usually based on a combination of historical performance, equipment capacity, workforce capability, and planned production rates.
Getting this number right is paramount. If your standard is too high or too low, your efficiency metric will be misleading. Remember that it should reflect a realistic, repeatable target, not a best-case scenario.
3. Calculate production efficiency
Once you have both figures, production efficiency is calculated using a simple formula:
Production Efficiency = (Actual Output ÷ Standard Output) × 100
If you get 100%, you’ve achieved production efficiency.
In real life, though, that’s not always the case. For example, if your plant is expected to produce 1,000 units in an hour but only produces 660 units:
(660 ÷ 1,000) × 100 = 66%
This means your operation is running at only 66% efficiency, clearly showing a gap between expected and actual performance that needs to be addressed.
More helpful metrics for measuring productive efficiency
Production efficiency gives you a high-level view, but it doesn’t show where performance is being lost.
To improve output, reduce waste, and control costs, you need a set of supporting metrics that explain why that number is what it is.
These KPIs help you pinpoint issues and take targeted action:
Overall Equipment Effectiveness (OEE)
OEE measures how effectively your equipment is performing under real operating conditions.
It combines three key factors:
- Availability: How often the equipment runs when scheduled
- Performance: How fast it is running compared to its designed capacity
- Quality: How much output meets the required standard
The formula is:
OEE = Availability × Performance × Quality
For example, if a plant operates at:
- 90% availability
- 85% performance
- 96% quality
OEE = 0.90 × 0.85 × 0.96 = 73.4%
This means the operation is achieving 73.4% of its full potential.
As a guide:
- 85%+ is a strong performance
- 60–80% is typical
- Below 60% indicates clear inefficiencies
OEE is powerful because it shows exactly where losses are occurring, whether from downtime, speed losses, or quality issues.
Cycle time
Cycle time measures how long it takes to produce one unit from start to finish. Reducing this metric increases throughput without adding resources.
Cycle Time = Total Run Time ÷ Number of Units Produced
For example, if a process runs for 420 minutes and produces 70 units:
420 ÷ 70 = 6 minutes per unit
A longer cycle time usually points to delays, inefficiencies, or bottlenecks within the process.
Yield
Yield measures how much of your total output meets quality standards.
Yield = (Good Units ÷ Total Units Produced) × 100
For example, if 92 out of 100 units meet the required standard:
(92 ÷ 100) × 100 = 92%
Lower yield highlights waste through defects, rework, or poor process control. Improving yield increases effective output without increasing production effort.
Unit cost
Unit cost shows the average cost to produce each unit or tonne.
Unit Cost = Total Production Cost ÷ Total Output
For example, if total production costs are $18,000 for 1,200 units:
$18,000 ÷ 1,200 = $15 per unit
Tracking unit cost helps you understand how efficiently resources are being used and where cost reductions can be made. In many industries, reducing cost per unit is the clearest sign of improved efficiency.
Asset utilisation
Asset utilisation measures how effectively equipment is being used over time.
Utilisation = Operating Time ÷ Available Time
For example, if a machine operates for 19 hours in a 24-hour period:
19 ÷ 24 = 79.2% utilisation
Low utilisation can indicate downtime, scheduling gaps, or underused assets. Improving it helps maximise output without needing extra equipment.
Factors that can impact productivity metrics
Whether in manufacturing or mining, every business wants to run at peak productivity. Yet in reality, most operations fall short because of a handful of recurring issues that quietly erode performance over time.
Here are the most common factors that can affect production efficiency:
Limited resources
Productivity is directly linked to how effectively resources are deployed. Constraints in labour availability, equipment capacity, or capital investment can constrain output and create pressure points across your business.
After all, when resources are stretched, maintenance is often delayed, assets are overworked, and inefficiencies start to build.
Therefore, balancing resource allocation with production demand is key to maintaining consistent performance.
Rigid systems
Processes that perform well at one level of output don’t always scale effectively. As production volumes increase, bottlenecks can emerge in equipment, labour, or material flow.
Without the right workflows, software and infrastructure in place, higher demand can lead to congestion, longer cycle times, and reduced throughput.
Ultimately, ongoing productivity requires systems that can grow seamlessly without introducing new inefficiencies.
Lack of accountability
Unclear responsibility for key areas like maintenance, performance tracking, and process improvement slows decisions and allows problems to linger.
Issues get passed around or addressed too late, turning small inefficiencies into larger losses. Consequences can range from inconsistent execution and avoidable downtime to missed improvement opportunities.
Conversely, high-performing operations set clear roles and responsibilities. Every metric, asset, and process has someone accountable for it, backed by defined standards and regular follow-through.
Supply chain barriers
Production can only move as fast as the inputs allow. Late deliveries, material shortages, and unreliable suppliers create stop-start conditions that reduce output and increase idle time. Even short delays can disrupt an entire shift or production run.
In Australia, logistics adds another layer of complexity. For instance, long transport distances can increase reliance on rail and haulage, impacting fuel costs, equipment wear, and available production hours.
To ramp up production efficiency, operations need strong supplier coordination, clear visibility over inbound materials, and contingency planning for disruptions.
Unplanned downtime
Unplanned downtime is one of the fastest ways to erode productivity. Equipment failures, process breakdowns, and poor maintenance practices can all halt production with little warning, reducing output and raising costs across the entire operation.
In Australia, external conditions add another layer of risk. Extreme heat, bushfires, and other weather events can force shutdowns or limit operating capacity, even when internal systems are running well.
To manage this properly, downtime needs to be categorised into controllable and uncontrollable causes. This gives a clearer view of what can be fixed internally and what needs to be planned around.
Compliance issues
Compliance is non-negotiable, but it can come at a cost to productivity. Requirements under WHS laws, environmental approvals, and cultural heritage regulations add layers of process, approvals, and administrative time.
These tasks can slow decision-making, extend timelines, and reduce available production hours.
That said, the risk of getting it wrong is far greater. Non-compliance may lead to fines, project delays, or full shutdowns.
That’s why efficient compliance management matters. Well-defined systems, clear processes, and early planning help minimise disruption while keeping operations moving.
Outdated, manual processes
Technology underpins modern production efficiency, but only when it’s used effectively.
Without clear visibility over performance data, it’s difficult to spot inefficiencies, track trends, and make confident improvements. Teams end up reacting to problems after they occur, rather than preventing them.
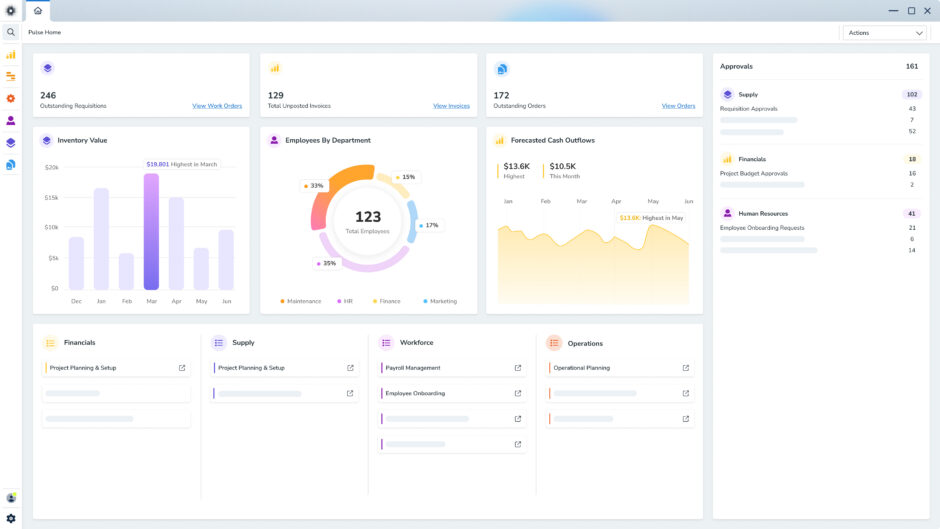
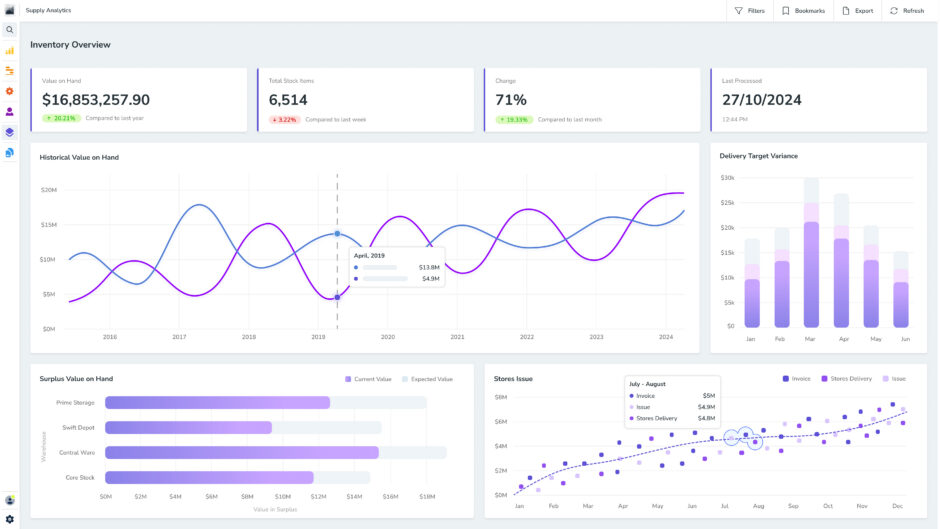
Using a smart software system like Pulse changes this. Workflow automation reduces manual effort and saves time, while real-time monitoring and advanced analytics provide a clear view of business-wide performance.
When implemented properly, these tools give operators tighter control, faster decision-making, and a more consistent level of production performance. More on this below.
How to boost production efficiency
To boost production efficiency, you need to build a sustainable system that consistently identifies waste, measures performance, and drives better decisions over time.
Let’s take a look at each step:
Define clear KPIs and baseline performance
Improvement starts with visibility. Begin by defining a small set of core Key Performance Indicators (KPIs) that reflect how your operation actually performs.
Common examples include labour productivity, equipment utilisation, OEE, cost per tonne, and schedule adherence.
Next, establish a reliable baseline for each metric, so you know exactly where performance stands moving forward.
From there, you can keep track of results on a regular basis. Daily and weekly reviews help spot trends, highlight bottlenecks, and measure whether changes are delivering real improvements.
Prioritise critical assets
Not all equipment impacts production in the same way. Some assets sit directly on the critical path. If they fail, production stops or slows immediately. Others play a supporting role and can tolerate short disruptions without affecting overall output.
The key is knowing the difference. An asset criticality assessment helps you rank equipment based on its real impact on safety, throughput, cost, and downtime.
Once identified, critical assets should receive priority across the board. This includes more frequent and structured maintenance, closer condition monitoring, faster access to spare parts, and clear escalation procedures when issues arise.
Focusing effort where it matters most reduces the risk of major disruptions, while helping your operations recover faster if something does go wrong.
Flag and remove bottlenecks
A bottleneck is where work slows down, queues build up, and output is capped. You might have other parts of the operation running efficiently, but if this constraint isn’t addressed, total production will not improve.
Bottlenecks typically show up as overloaded equipment, repeated breakdowns, slow processing stages, or delays in materials and parts. You’ll often see work piling up before one step, while downstream resources sit idle waiting.
The key here is to focus on overall flow, instead of individual performance. Identify where production is consistently backing up, investigate why, and fix the root cause.
This could mean improving maintenance, increasing capacity, adjusting scheduling, or resolving supply issues.
Removing a bottleneck is one of the highest-impact actions you can take. Even a small improvement at the constraint point can lift output across the entire operation without major capital investment.
Standardise and streamline workflows
Inconsistent processes lead to inconsistent results.
When the same task is performed differently across teams or shifts, it’s difficult to maintain output, control quality, or identify where issues are coming from.
Standard Operating Procedures (SOPs) remove this variability by setting a clear and predictable way of working. Before you share these steps, review your current workflow for inefficiencies and look for practical ways to simplify each activity.
Data also needs to be standardised. If various departments view operating time, downtime, or output differently, performance comparisons won’t match up. Keep everyone on the same page by agreeing on data sources and calculation rules from the outset.
Equipped with dependable processes and numbers, you’ll find performance gaps easier to flag and faster to fix.
Optimise production planning and scheduling
Production efficiency is driven by how well work is planned and sequenced.
When targets are unrealistic or disconnected from actual demand, you either end up with idle equipment and underutilised labour, or rushed jobs that risk errors, rework, and downtime.
Strong planning starts with accurate demand forecasting, so production volumes match real requirements. From there, scheduling needs to reflect actual capacity, including available labour, equipment constraints, maintenance windows, and material supply.
With effective planning, production flows more smoothly, disruptions are reduced, and output is more stable.
Stay on top of preventive maintenance
Equipment rarely fails without warning. The problem is that those warning signs are often missed.
Preventive maintenance reduces risk by servicing equipment at set intervals based on usage, time, or manufacturer guidance. It keeps assets in working condition and avoids unnecessary breakdowns.
For instance, with Pulse’s preventive maintenance tools, you can create standardised checklists, configure maintenance plans, and automate work orders.
The advantage here is control. Instead of reacting to breakdowns after they stop production, maintenance can be planned around operations with minimal disruption.
Over time, this leads to more reliable equipment, fewer unexpected stoppages, and steadier output.
Train your team
Even the best systems rely on people to execute them properly. If your teams aren’t clued in on the latest tools and best practices, processes can break down quickly. Tasks are missed, issues go unresolved, and performance fluctuates.
By delivering in-depth training, you can help to ensure each team member has the skill sets to contribute to production efficiency.
This training should involve more than a one-off induction. It needs to cover how work is done, why it is done that way, and what strong performance looks like. This includes clear instructions on standard procedures, safe equipment use, and how to identify and report problems early.
Regular refresher training is just as important. As processes, technology, or site conditions evolve, employees need to stay up to date to maintain performance.
Take advantage of technology
Technology is one of the fastest ways to boost production efficiency.
When operations rely on manual or disconnected systems, data is often delayed, incomplete, or inaccurate. This halts decision-making and makes it harder to identify areas for improvement.
Modern software can solve this by automating routine tasks, capturing reliable data in real time, and giving teams a precise, up-to-date view of performance across the entire operation.
The Pulse Production ERP module brings these capabilities together in one place, empowering your people to manage activities with greater precision:
- Real-time analytics: Monitor operations as they happen using live dashboards, automated reports, and optional SCADA integration.
- Unified production planning: Connect production schedules with planning tools to improve coordination across teams. Make faster, better-informed decisions around activities like drill and blast, based on current conditions.
- Flexibility: Support a wide range of environments, from underground to surface operations, across metals, minerals, and aggregates. Adapt to different sites without changing systems or workflows.
- End-to-end stockpile tracking: Maintain a clear, auditable record of material movement from source to final destination. Track balances, transactions, and flow to reduce errors, avoid stockouts, and improve material control.
- Integrated budgeting and forecasting: Align production targets with operational and financial data by importing forecasts from planning or finance systems. Improve cost control, scheduling accuracy, and long-term decision-making.
- Mobile access in the field: Capture data, monitor performance, and update schedules from anywhere, even offline. This ensures teams stay connected, report issues in real time, and maintain control across remote or fast-moving operations.
When implemented properly, this technology gives your team the clarity and control needed to run a more efficient, consistent, and responsive operation.
FAQs
You can achieve optimal efficiency when you consistently produce the highest possible output using the least amount of resources, without compromising product standards.
This comes down to removing waste at every stage of the process. That includes reducing downtime, tightening workflows, improving maintenance, and ensuring materials are used with minimal loss.
High-performing operations also rely on real-time data, clear KPIs, and continuous improvement practices to identify issues early and fix them quickly.
Inefficient production happens when more resources are used than necessary to produce the same output.
This can include wasted materials, excess labour hours, unnecessary energy use, or frequent equipment stoppages.
It often points to deeper issues such as poor planning, outdated processes, lack of maintenance, or bottlenecks in the workflow.
The impact is higher costs, lower output, and reduced profitability. Therefore, left unchecked, inefficiency makes it harder to compete and scale.
Production efficiency and allocative efficiency both relate to resource use, but they answer different questions.
Production efficiency refers to how to produce goods at the lowest possible cost, with no waste. It focuses on how well your processes run.
Meanwhile, allocative efficiency concentrates on producing the right goods, in the right quantities, to meet demand. It revolves around whether resources are being used where they create the most value.
A business can be production efficient but still miss the mark if it produces goods the market doesn’t need. That’s why strong performance requires both.
Yes, production efficiency should be tracked continuously.
For example, critical KPIs like tonnes per hour, labour productivity, and equipment utilisation should be reviewed at least once per shift and in daily production meetings.
Regular tracking gives you a clear view of performance over time and makes it easier to spot trends, identify bottlenecks, and measure the impact of changes.
Without consistent monitoring, inefficiencies often go unnoticed until they affect output or margins.
At a minimum, you should review efficiency metrics every month, with more frequent tracking in high-volume or complex operations.
To compare productivity properly, you need to make the data consistent first.
Start by standardising your core metrics, such as cost per tonne, tonnes per labour hour, or output per shift. Then adjust these figures to account for real-world differences like ore type, strip ratio, haul distance, and logistics complexity.
Next, weigh up like-for-like operations. For example, assess similar sites, teams performing the same tasks, or products with comparable production requirements. This keeps the insights relevant, fair and actionable.
In most cases, your best benchmark is internal. Your top-performing site, team or product line shows what is already achievable within your business, making it the most practical reference point for improvement.
Productivity and ESG goals can be aligned by measuring resource use alongside output. This includes tracking energy intensity, such as gigajoules per tonne, and emissions intensity, like tonnes of CO2-e per tonne produced.
Many efficiency improvements, including reducing fuel use or minimising waste, directly support emissions reduction targets.
By reporting productivity and ESG metrics together, your business can demonstrate both operational performance and responsible resource management.
Streamline production with Pulse
Production efficiency aims to maximise output from the resources you already have, without increasing cost or sacrificing consistency.
The challenge is that inefficiencies are often hidden in day-to-day operations, only becoming visible once they impact output, margins, or deadlines.
That’s why accurate, live data is critical on high-pressure sites, where downtime, delays, and inefficiencies directly affect your bottom line.
Improve output, reduce waste, and make faster, more informed decisions with Pulse Production.
This powerful ERP module brings together your people, processes, and assets into one platform, giving you the visibility and control needed to run a more efficient operation.
With automated workflows, integrated production data, and live custom reporting, you can move from reactive decision-making to proactive control.
That means fewer surprises, better planning, and more consistent output. Request a free demo today.