Customer demand, supply chains, labour availability, interest rates and market conditions are constantly shifting. That’s why businesses can’t rely on static plans or outdated assumptions to plan for the future.
Cue business forecasting. By grounding predictions in reliable performance data, you can set practical budgets, manage risk, protect cash flow and act before minor issues become major problems.
Here, we explain what business forecasting is, why it matters and how to do it. Keep reading to learn how this process can help you make stronger, more informed decisions.
What is forecasting in business?
Forecasting is the process of using past performance data and practical assumptions to predict business trends and market conditions. It helps you plan for potential revenue, cash flow, demand, industry shifts, and other key factors.
Importantly, forecasting doesn’t guarantee the future. Instead, it gives your team a clearer view of likely outcomes, so you can make informed decisions about budgets, purchasing, projects, hiring and growth.
For example, a business might forecast sales demand before ordering inventory, estimate labour needs before a busy season, or model cash flow before investing in new equipment.
How can forecasting help a business?
Forecasting helps a business plan ahead with more confidence. By using past performance, current data and realistic assumptions, your team can prepare for likely challenges and growth opportunities.
Let’s take a look at the benefits of business forecasting.
Make smarter investments
Forecasting gives leaders a clearer view of where spending is likely to drive value. A business might use forecasts to assess a new product launch, hire additional staff, increase marketing spend or expand into another location.
By comparing estimated costs, revenue, timing, and risk, leaders can back the strongest opportunities and avoid investing capital in decisions that appear strong on the surface but may weaken long-term financial stability.
A high-level forecast might be enough for general planning, while major decisions, like acquisitions, expansion or large capital purchases, need deeper modelling and more detailed assumptions.
Cash flow sits at the centre of this.
Without enough cash available at the right time, even strong businesses can stall. Forecasting helps identify where investment makes sense, where risk is building and which opportunities deserve priority.
Ground decisions in accurate data
Forecasting helps businesses make effective decisions based on data. Sales history, customer behaviour, stock movement, market shifts and performance data can all shape a more accurate view of what might happen next.
This matters because business conditions change quickly. If customer demand rises, buying patterns shift or supply costs increase, live data can help teams update forecasts before the impact becomes harder to manage.
For instance, a sales forecast built on current enquiry volumes, conversion rates and purchasing trends gives you a stronger base for planning than last year’s numbers alone.
Set practical goals
Forecasting helps businesses set measurable and realistic goals. Instead of choosing targets based on hope, you can use past performance, current capacity and expected market conditions to understand what your business can reasonably achieve.
This can apply to everything from revenue, sales volume, and profit margins to market share, production output and customer growth.
Once those targets are set, teams can track progress against clear benchmarks and adjust early if results start moving off course.
Inform budgeting
A useful budget does more than assign numbers to departments. It shows where money should go, where costs may increase and which areas need tighter control.
Forecasting supports that process by linking budget decisions to likely business conditions. It helps estimate future revenue, expected costs and the level of funding needed to keep the business running smoothly.
When forecast data sits alongside current operational insights, you can allocate funds more effectively. That may mean increasing spend in areas with clear growth potential, reducing waste, or preparing for higher costs before they impact margins.
Plan for contingencies
Demand might rise or fall. Supply costs can shift. Labour needs may change. Market conditions could tighten.
Forecasting gives businesses time to prepare properly for various outcomes like these instead of reacting under pressure.
This is especially valuable during seasonal peaks and uncertain economic conditions. If a business expects demand to rise, it can increase production, secure stock or roster staff earlier. If a slowdown looks likely, you can review costs, protect cash flow and delay lower-priority spending.
Boost operational efficiency
Forecasting fuels efficiency by helping businesses plan production, stock, logistics, labour and resources around expected demand.
When teams know what’s likely to be needed, they can reduce waste, avoid overordering and keep operations moving.
The same thinking applies across the wider operation. Better forecasts support smoother scheduling, stronger supplier planning, cleaner distribution and more accurate resource allocation.
Assess growth opportunities
Forecasting helps businesses evaluate growth opportunities before committing time, money or resources. It’s particularly useful when entering a new market, launching into another region or expanding your customer base.
That’s because a forecast can estimate demand, revenue potential, costs, competition, resource needs and likely risk. This gives you a clearer view of whether an opportunity is commercially sound or too risky to pursue.
Forecasting with pro forma statements
Many businesses use pro forma statements to understand how future decisions may affect revenue, profit, cash flow and overall financial position.
This forecast financial report is built around a clear set of assumptions. It can show what could happen if the business expands, hires more staff, wins a major contract, buys new equipment, changes suppliers or enters a new market.
A pro forma forecast usually includes:
- Profit and loss statements
- Balance sheets or statements of financial position
- Cash flow statements
Internally, these forecasts can help you weigh up the pros and cons of different options before you commit. For example, a business might model the likely cost of expansion against projected revenue, margins, cash flow pressure and working capital needs.
Externally, pro forma statements help banks, investors and other stakeholders understand the possible financial impact of a major event, like a merger, acquisition, or capital raise.
It’s important to know that pro forma information isn’t a replacement for statutory financial reporting. It often adjusts for unusual or one-off costs, like relocation expenses, major equipment purchases or restructuring costs, to give a clearer view of ongoing performance.
How to do a business forecast
Most forecasting methods fall into two main categories.
Quantitative methods
Quantitative forecasting uses historical data to estimate future business performance. The right method depends on the quality of your data and the decision you need to make.
A simple forecast may only need a straight-line calculation, whereas a more complex business may need regression analysis, moving averages or several methods working together.
Straight line
Straight-line forecasting assumes that past growth or decline will continue at the same rate. It’s one of the simplest quantitative forecasting methods and is often used to project revenue, sales or expenses.
For example, if revenue grew by 7% last year, a straight-line forecast would assume revenue will grow by another 7% next year.
Easy to understand and quick to apply, this method is best for stable businesses with predictable growth patterns.
Its main weakness is that it doesn’t account for changing conditions, like new competitors, supply issues, cost increases, seasonal shifts or changes in customer demand.
Ultimately, straight-line forecasting is a good starting point, not a complete view.
Per cent of sales
The percentage of sales method estimates future financial figures by linking them to expected sales. It assumes that certain costs or accounts will move in proportion to revenue.
For example, if the cost of goods sold has usually been 20% of sales, the business may use that same percentage to forecast future cost of goods sold. If sales are expected to increase, the related costs are projected to rise as well.
This method can be useful for preparing internal forecasts, pro forma statements and budget models. It works best when the relationship between sales and expenses is stable. If supplier costs, wages, freight or pricing structures change, the assumptions should be reviewed before the forecast is used.
Simple linear regression
Simple linear regression forecasts a result by measuring the relationship between two variables. One variable is the outcome you want to predict, while the other is the factor that may influence it.
For instance, a business might use simple linear regression to estimate how advertising spend affects sales. If the data shows a clear relationship, the business can use that pattern to forecast future sales based on planned marketing spend.
The basic formula is:
Y = BX + A
Where:
Y = the forecasted result
B = the slope of the regression line
X = the influencing variable
A = the starting point, or Y-intercept
This method is helpful when one main factor has a measurable effect on the result. It’s less reliable when several factors influence performance at the same time.
Multiple linear regression
Multiple linear regression forecasts future results by analysing the relationship between one outcome and several influencing factors.
For example, you might use multiple regression to forecast sales based on advertising spend, seasonality, pricing, customer demand and economic conditions.
This gives a more detailed view than simple regression because it considers several drivers at once. It’s useful when dealing with more complex business operations or larger datasets.
To work well, the variables need a clear relationship with the result being forecast. They also need to be different enough from each other so that the model can identify which factors are actually affecting performance.
Moving average
Moving average forecasting uses the average of previous periods to estimate future results. It helps smooth out short-term spikes or dips, making it easier to see the underlying trend.
For instance, a business could forecast next month’s sales by averaging sales from the previous three months. This can be useful for short-term planning, especially when demand changes from month to month.
The basic formula is:
Moving average = A1 + A2 + A3 / N
Where:
A = result for each period
N = number of periods used
A weighted moving average gives more importance to recent results. This can improve accuracy when newer data better reflects current conditions.
Moving averages are often used for sales, revenue, inventory and demand forecasting. They can work well when patterns are fairly stable and no major changes are affecting the business.
Qualitative methods
Qualitative forecasting uses human insight to estimate future business performance when historical data is limited, incomplete or not enough on its own. It draws on customer feedback, market research, expert opinion and management experience to understand what may influence demand, revenue, costs or growth.
Rather than relying only on numbers, qualitative forecasting looks at the wider context.
What are customers saying?
How are competitors moving?
Are supplier conditions changing?
Is the market becoming more price-sensitive?
These insights are especially useful when a business is launching a new product, entering a new market, responding to changing customer behaviour or planning around conditions that past data can’t fully explain.
As qualitative forecasting is more subjective than quantitative forecasting, it needs structure. The best results come from clear questions, reliable sources and a mix of viewpoints.
Market research
Market research uses feedback from customers, suppliers, industry experts and the broader market to support business forecasting. It can include surveys, interviews, focus groups, competitor reviews and customer behaviour analysis.
This method helps businesses understand demand, pricing expectations, buying patterns and customer needs before making decisions.
For example, a business could survey customers before launching a new service, interview suppliers about expected cost changes, or review competitor activity before entering a new region.
These insights can then support forecasts for sales, revenue, stock, staffing and marketing spend.
Market research works best when it starts with a clear question. Instead of asking for broad opinions, you should define what you need to know, such as whether demand exists, what customers are willing to pay, or which barriers may affect uptake.
The Delphi method
The Delphi method uses a panel of experts to forecast future outcomes. A facilitator asks each expert to provide their view, usually through a questionnaire, then shares the combined feedback with the group for further review.
This process continues over several rounds until the responses move towards a clear position or shared view.
Ultimately, the Delphi method helps reduce individual bias and gives the business a more balanced forecast.
It’s useful when there’s a lack of reliable historical data, or when a business needs to forecast complex events like market change, technology adoption, regulatory shifts or long-term industry demand.
Tips for creating an accurate business forecast
1. Check your business plan and structure
A business plan outlines where the business is heading, how it plans to grow and what resources it needs to get there.
For forecasting, it gives your team a clear reference point for expected revenue, costs, capacity and future priorities.
If your business plan is outdated, the forecast will be built around goals, costs or assumptions that don’t fit anymore.
Your business structure also matters.
As a business grows, its original setup might no longer support its commercial, tax, reporting or operational needs. This can affect cash flow, compliance, decision-making and future investment.
By reviewing its plan and structure, you can see whether your business is set up to support the forecast or if you need to make some changes first.
2. Audit previous business forecasts
Past forecasts can show where your planning is strong and where assumptions need work. Compare previous forecasts against actual results to see where the numbers were accurate, where they missed the mark and why.
Look for patterns.
Did sales come in lower than expected during certain months?
Were wage costs underestimated?
Did supplier price rises, project delays or stock shortages affect the result?
These details help improve the next forecast.
Importantly, this forecast should draw from more than the latest results. Recent data can be useful, but it mightn’t show seasonal shifts, market cycles or longer-term trends.
Reviewing a wider history gives your forecast more depth and helps you avoid placing too much weight on one unusual month or quarter.
3. Tweak your forecasting regularly
A business forecast should change with your business. Review it regularly and update it when new data becomes available, especially when actual results move away from expected performance.
Monthly reviews are useful for tracking revenue, costs, cash flow and margin changes, while quarterly reviews give you a chance to test bigger assumptions, such as sales growth, staffing needs, supplier pricing, stock levels and investment plans.
Regular forecasting also builds a clearer performance history.
Over time, the business can see which assumptions hold up, which areas need closer monitoring and which trends are starting to affect future results.
4. Only use reliable data
Forecasting depends on the quality of the data behind it. If your financial reports are incomplete, outdated or inconsistent, they’ll carry the same problems into future planning.
To get relevant and precise information, you should review the following reports:
- Balance sheet or statement of financial position: This shows a business’s assets, liabilities and equity at a specific point in time. It helps you understand financial strength, debt levels, working capital and available resources.
- Cash flow statement: This tracks money moving in and out of the business. It’s one of the most important documents for forecasting because profit doesn’t always equal available cash. A cash flow forecast can help identify pressure points before they affect wages, suppliers, finance commitments or operations.
- Profit and loss statement: This details revenue, costs and profit over a set period. It helps you determine whether your business is growing profitably, where expenses are rising and which areas need adjustment.
Accurate historical sales data is also essential, particularly for businesses affected by seasonality, project cycles or changing demand. Past sales patterns, market trends, supplier costs and broader economic conditions can all help create a more realistic forecast.
If past data is unreliable, start improving it now. Better reporting, consistent data entry and connected systems make every future forecast stronger.
FAQs
A financial forecast estimates what’s likely to happen based on current performance, historical data and changing business conditions, whereas a budget sets the targets a business wants to achieve.
A budget usually covers a set period, like the financial year, and outlines expected revenue, expenses, cash flow, capital spending and debt commitments. Once approved, it often stays fixed so the business can measure performance against it.
A forecast is more flexible. It evolves as new information becomes available, such as actual sales, cost increases, stock movements, market shifts or changes in customer demand. This helps you see whether the business is still on track or needs to adjust.
Here are their core differences:
| Budget | Forecast |
| Sets targets for a fixed period | Predicts future financial performance |
| Usually prepared once a year | Reviewed and updated regularly |
| Helps control spending | Helps guide decisions |
| Measures what the business planned to do | Shows what is likely to happen next |
Most businesses should forecast across more than one timeframe:
- 6 to 12 weeks for short-term cash flow, stock, staffing and supplier planning
- 12 months for budgeting, sales targets and operational planning
- 1 to 3 years for growth, expansion, capital investment and strategic decisions
That said, the right timeframe depends on the business. A retailer might need tight weekly demand forecasts during peak seasons, while a mining services business could rely on multi-year forecasts to plan equipment, labour, contracts and project capacity.
The key is to match the forecast period to the decision being made. If the decision affects cash next month, use a short-term forecast. If it affects growth, assets or funding, use a longer view.
Most businesses should review their forecast monthly, update it when major changes occur and complete a deeper review each quarter.
A monthly review helps compare actual performance against expected results. This can show whether revenue, expenses, cash flow, margins or stock levels are moving off course.
A forecast should also be updated when something significant changes, such as:
- Winning or losing a major customer
- Supplier prices increasing
- Wage, rent or finance costs changing
- Launching a new product or service
- Entering a new market
- Seeing a shift in customer demand
- Facing a change in economic or industry conditions
Lastly, a quarterly review gives leaders time to step back and test the bigger picture. It can help confirm whether targets still make sense, whether budgets need pressure testing and whether the business has enough resources to meet future demand.
A business forecast doesn’t need to predict the future perfectly. What matters is that it’s accurate enough to help you make confident decisions.
The right level of accuracy depends on the risk level and timeframe.
If getting the number wrong could create a serious cash or operational problem, the forecast needs closer review. If the matter is less sensitive, a broader estimate can still be useful.
Moreover, a short-term cash flow forecast needs to be tighter because even a small gap can affect wages, supplier payments or day-to-day operations. On the other hand, a three-year growth forecast can allow more movement because market conditions, costs and demand will change over time.
Rather than wasting time and resources chasing 100% accuracy, you should define an acceptable margin of error for the specific circumstances.
The most common business forecasting mistakes are:
- Using disconnected or inaccurate data: Forecasts lose value when teams pull figures from separate systems that don’t match. Sales, finance, operations, HR and inventory data should connect wherever possible, so you can work from a single source of truth.
- Assuming the past will repeat itself: Historical data matters, but it can’t do all the work. Market conditions, supplier costs, customer behaviour, competitor activity and internal business changes can all affect future outcomes.
- Setting and forgetting: A forecast shouldn’t sit untouched for months. Businesses need to review it when performance changes, costs move, demand shifts, or new opportunities appear.
- Only planning for one outcome: One forecast can create a false sense of certainty. Scenario planning helps businesses prepare for best-case, expected and worst-case outcomes, especially when cash flow, margins or supply chains are under pressure.
- Relying too heavily on spreadsheets: Spreadsheets can work for simple forecasts, but they’re tough to manage as a business grows. Version control issues, broken formulas and manual updates all weaken accuracy. Automated business software can minimise manual work, improve precision and give your teams quicker access to current data.
Take the stress out of business forecasting with Pulse
Financial forecasting helps businesses make sharper, more confident decisions. By using past performance to understand what might happen next, you can protect cash flow, manage changing conditions and act quickly on promising opportunities.
Not sure where to start?
The right technology can simplify this complex task, freeing up your finance teams to focus on strategy instead of number crunching.
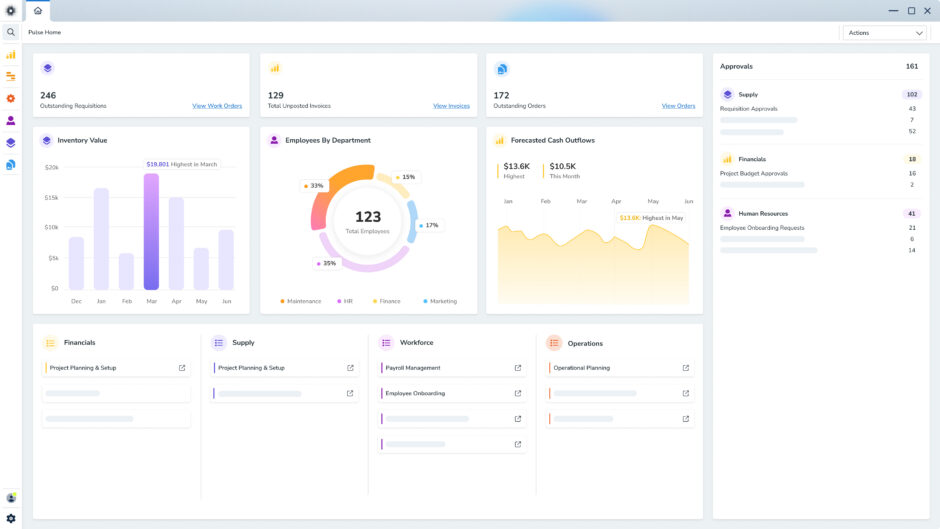
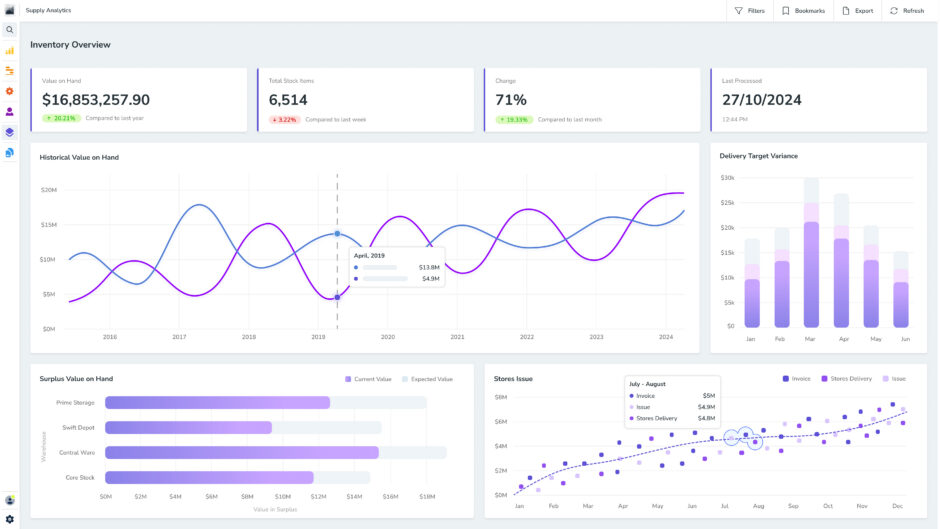
Backed by automated workflows and predictive insights, Pulse Financials gives you the tools to build more accurate business forecasts.
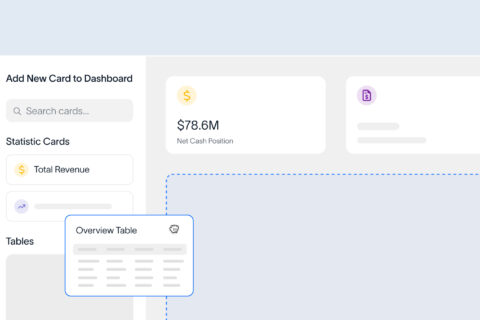
The Banking Dashboard shows forecasted cash inflows and outflows, helping you estimate upcoming revenue, expenses and cash flow needs faster.
Meanwhile, the Costing Module supports forecasting, budgeting and actuals tracking, so you can compare planned performance against real results across your business.
Request a free demo to learn more.